...
Figure 11: Dome Model Run - Selecting Inputs

Figure 12: Dome Model Run - After execution
Developing Gaps that were not in DOME/DMC
It is quite possible that the existing code base in Dome/DMC may not exist for the application one is building. In this case when we were running the Wind Model script (Figure 7) we found that the matlab engine took longer time to load the mat file. So we had to modify the MatlabPluginR2014.dll. We added extra time for evaluation of the matlab engine command. Also if the matlab command in the script is long command then additional time was provided for its completion.
The Dome Model outputs shown in Figure 12 had to be plotted like how the Scope shows in Simulink. We did not have a charting tool to show multiple charts so we developed a servlet named "TwoColumnCharts". This servlet uses the titles from "GraphTitles.txt" (see table 2) and data from the Dome Model output. We do have an option to develop swing based java application and display the charts in Dome Client. This TwoColumnCharts servlet can be generalized but for now this serves this use case.
The servlet, TwoColumnCharts, in proxytest.html is as follows, where the param OutParamsData passes the data JsonText_2.txt as a text file. This text file data contains the data when ParameterValueChangeEvent occurs for the param name "Grid Data" and param name " Turbine Data". These were currently copied from from DomeApiServices.txt , but can be obtained by being a consumer to the ActiveMQ server queues.
<FORM METHOD="POST" ACTION="http://localhost:8080/SimpleServlet/TwoColumnCharts" >
<input type="hidden" name="OutParamsData" value="JsonText_2.txt"/>
<INPUT TYPE="SUBMIT" VALUE="TestServlet">
</FORM>
Visualization of the Wind Model Output plots
This use case was tested by first installing Tomacat Serve, ActiveMQ and DomeServicesAPIV7. Detailed instructions for setting this up is in /wiki/spaces/DMC/pages/19496967. We started Tomcat and ran /DomeApiServicesV7/proxytest.html. Figure 13 shows the result when the "Run" button was clicked for the "WindDFIG Matlab Model".
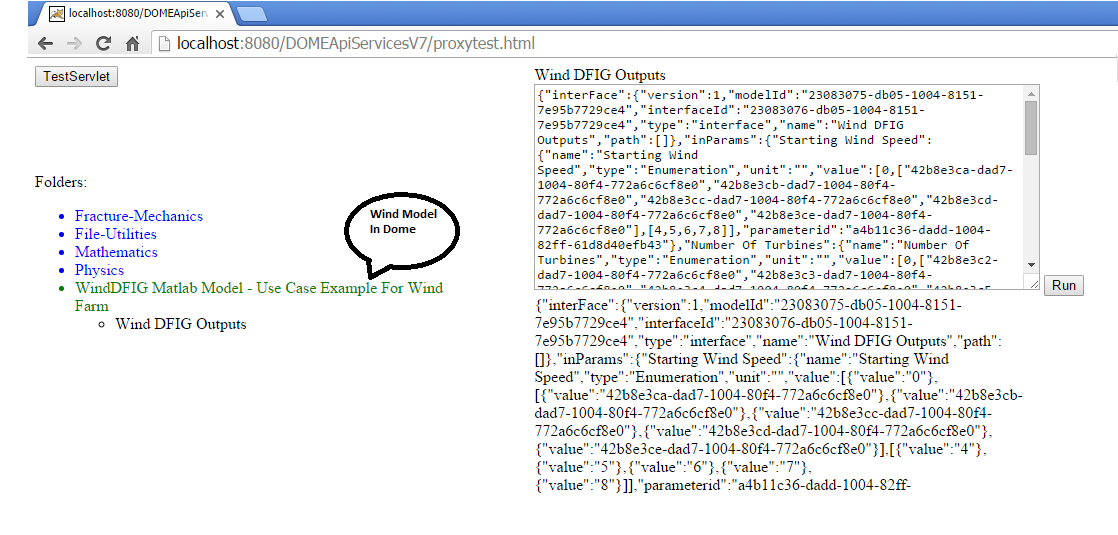
Figure 13: Wind Model run in the Web
...
Browser
Notice that we added the button "TestServlet" in proxytest.html to test the TwoColumnCharts servlet. When we press that we get all the plots as shown below in Figure 14
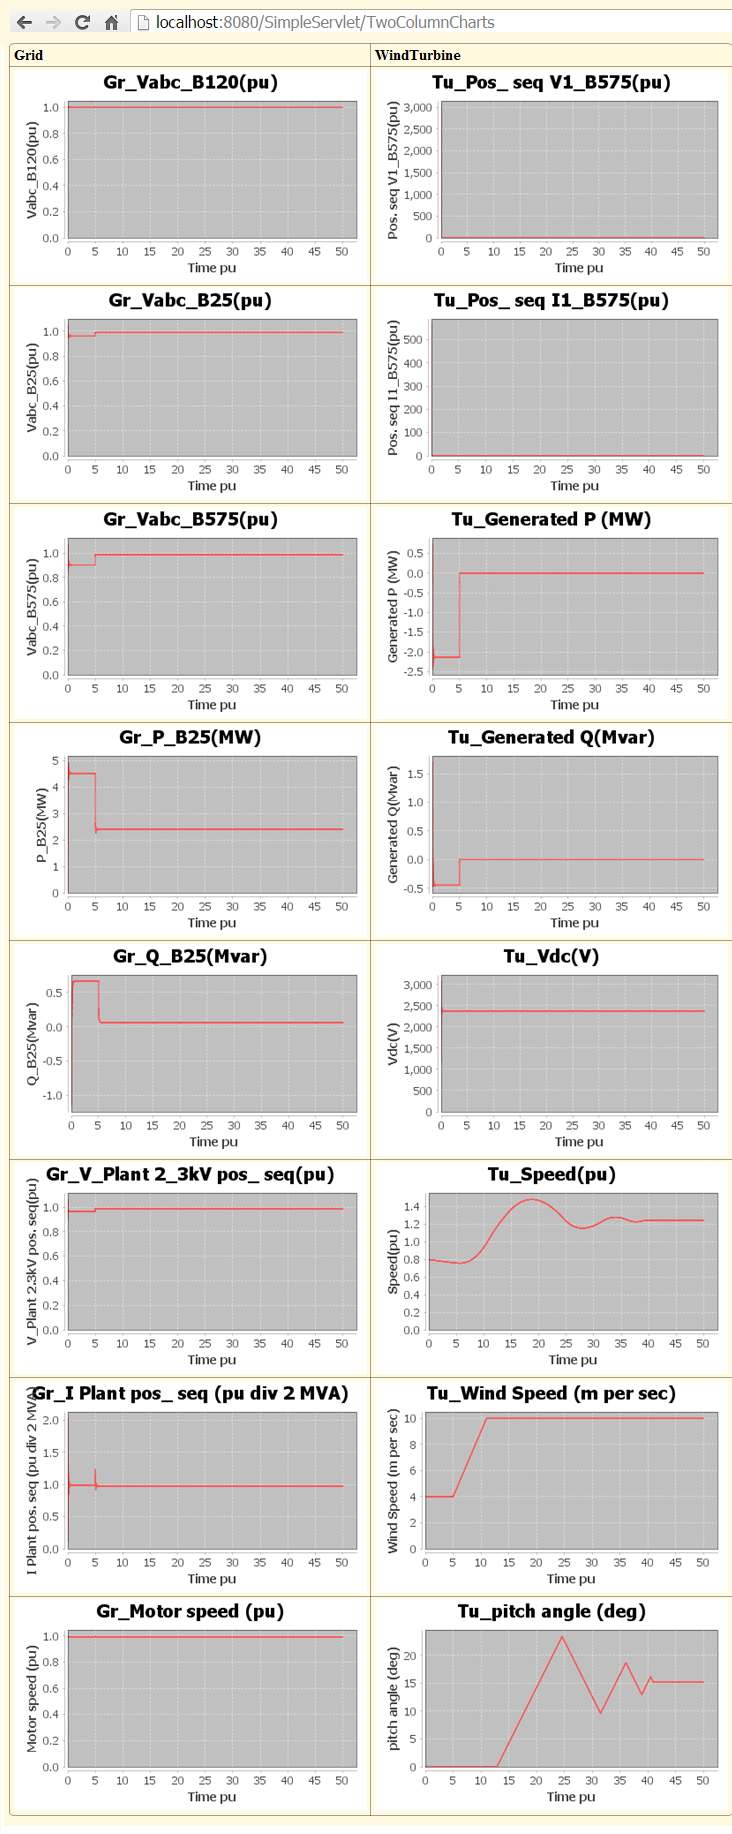
Figure 14: Plots from TwoColumnCharts Servlet
Conclusion
In this example we have shown how a Model Created in Matlab using Simulink is used by the user community to observe the behaviour of the Wind Turbine or Grid Data depending on the parameters selected by the user. This can be seen as a service to the user community who do not have the expensive Matlab Simulink. A researcher can analyze data,a power system planner can validate if Grid Data will meet reliability standards, Wind Plant developers can study the impact of the turbines, the operator can use the Grid Data and Turbine Data to troubleshoot when grid plots are not as expected and the Consultants can make proper business decisions like how many turnines to to order, location of the farm.
References
1] http://www.nrel.gov/docs/fy12osti/52780.pdf, National Renewable Energy Laboratory Report, Mohit Singh Surya Santoso.
2] http://www.mathworks.com/help/physmod/sps/examples/wind-farm-dfig-detailed-model.html, Richard Gagnon (Hydro-Quebec)